In order for businesses to succeed in the long run, they need to be able to collect and analyze data. Without data, it becomes increasingly difficult to learn more about your customers without guessing. The right data allows business owners to make smarter decisions and provide the best experiences for customers.
There’s plenty to be gleaned from customer data, and modern businesses are using that data to assess performance and make calculated and educated business decisions.
Here are some of the best ways big businesses are using such data to improve their workflow, day to day operations and ROI across the board.

Big Data
When it comes to business technology, big data plays a huge role. Big data is the process of gathering large amounts of data to better understand patterns and how business decisions correlate and affect one another. The fact is, data is growing every single day and becoming an increasingly complex and convoluted aspect of business. Long gone are the days where knowing was the de facto approach to analytics; today, it’s evolved to learning. More companies are embracing technology and taking the time to learn from the numbers.
Sometimes, real world examples of big data can help companies better understand the role it plays. For instance, Netflix is a great example of a company that used big data to create better targeted advertisements. With nearly 160 Netflix subscribers, it is clear they collect a substantial amount of data. As a subscriber, you may have noticed that you receive recommendations on what to watch next. This is possible because Netflix aggregates your past search and watch data. This detailed, data-driven recommendation system influences 80% of the content streamed on Netflix.
But it’s not just big businesses that can benefit. Data has made it possible for small companies to utilize platforms that make it easy to make data-based decisions.
For example, if you use custom envelope printing services to create a direct mail campaign, you could easily track which of your new customers arrived as a direct result of your mailing efforts. Data makes this possible.
According to Smallbizgenius.net, the following key statistics were in play for postal mail and offline marketing during 2018-2019.
- 42.2% of direct mail recipients either read or scan the mail they get.
- Direct mail requires 21% less cognitive effort to process than email.
- Direct mail recipients purchase 28% more items and spend 28% more money than people who don’t get that same piece of direct mail.
- Direct mail offers a 29% return on investment.
- 73% of American consumers say they prefer being contacted by brands via direct mail because they can read it whenever they want.
Record to Report
In every aspect of your business, technology streamlines facilitation. A few example of this can be seen through the solutions, applications and providers below.
- Reed Group absence management helps you manage your employees
- Gusto automates your payroll processes
- Git makes cloud development a synch.
The same holds true for record to reports. A record to report is a thorough management process that involves collecting, processing, and analyzing data to create reports that make it easier for companies to gather strategic feedback. Proper record to report automation streamlines this process. Armed with this valuable feedback, business owners and marketers can gain a better understanding of how the business is performing.
Good records will allow you to complete a variety of business tasks pertinent to success. Armed with detailed financial reports, you’ll be able to monitor the progress of your business in a bare-bones, clear-cut manner. Identify different sources of income and spending to determine where you can boost strategies and where certain strategies can be eliminated to save money.
Website Metrics
Website metrics offer plenty of information, and an equal amount of opportunities to analyze performance. One of the most important metrics that modern businesses need to understand is where their visitors are coming from. This boils down to several key metrics.
According to NeilPatel.com, the following metrics are key when trying to analyze site data and customer engagement.
- Traffic
- SERP rankings
- Time spent on site
- Pages per visit
- Returning customers
- Social Sharing
- Clicks from social platforms
For instance, you want to know what devices your visitors are coming from. Are they most often visiting on mobile devices, or desktop? Are they using Samsung devices or iPhones? Understanding the devices used can help you reach your current and potential customers in new and efficient ways.
Referral sources are also important. Are most of your visitors coming from organic search (usually directly linked to your SEO efforts), email marketing, paid ads, social media, and other sources. This is where you can gain a deeper understanding of where to focus your marketing efforts. If your visitors tend to come from a specific website—let’s say a blog—you’ll know that your visitors tend to trust that blogger, which can offer opportunities for partnership.
You also want to pay attention to Time on Site. Time on site is exactly how it sounds: it reveals how long visitors stay on your website. This is an important metric because it reveals whether your site is useful and where people are spending the most time.
Heat Maps
You can take website metrics a step further by using heat maps to see which areas of a particular page capture the most attention. This allows you to see exactly how users navigate around your website. You’ll recognize what parts of the page weigh more, while other parts are often ignored.
To learn more about this process, be sure to check out the visual heatmap example below, as provided by the team over ayt CrazyEgg.
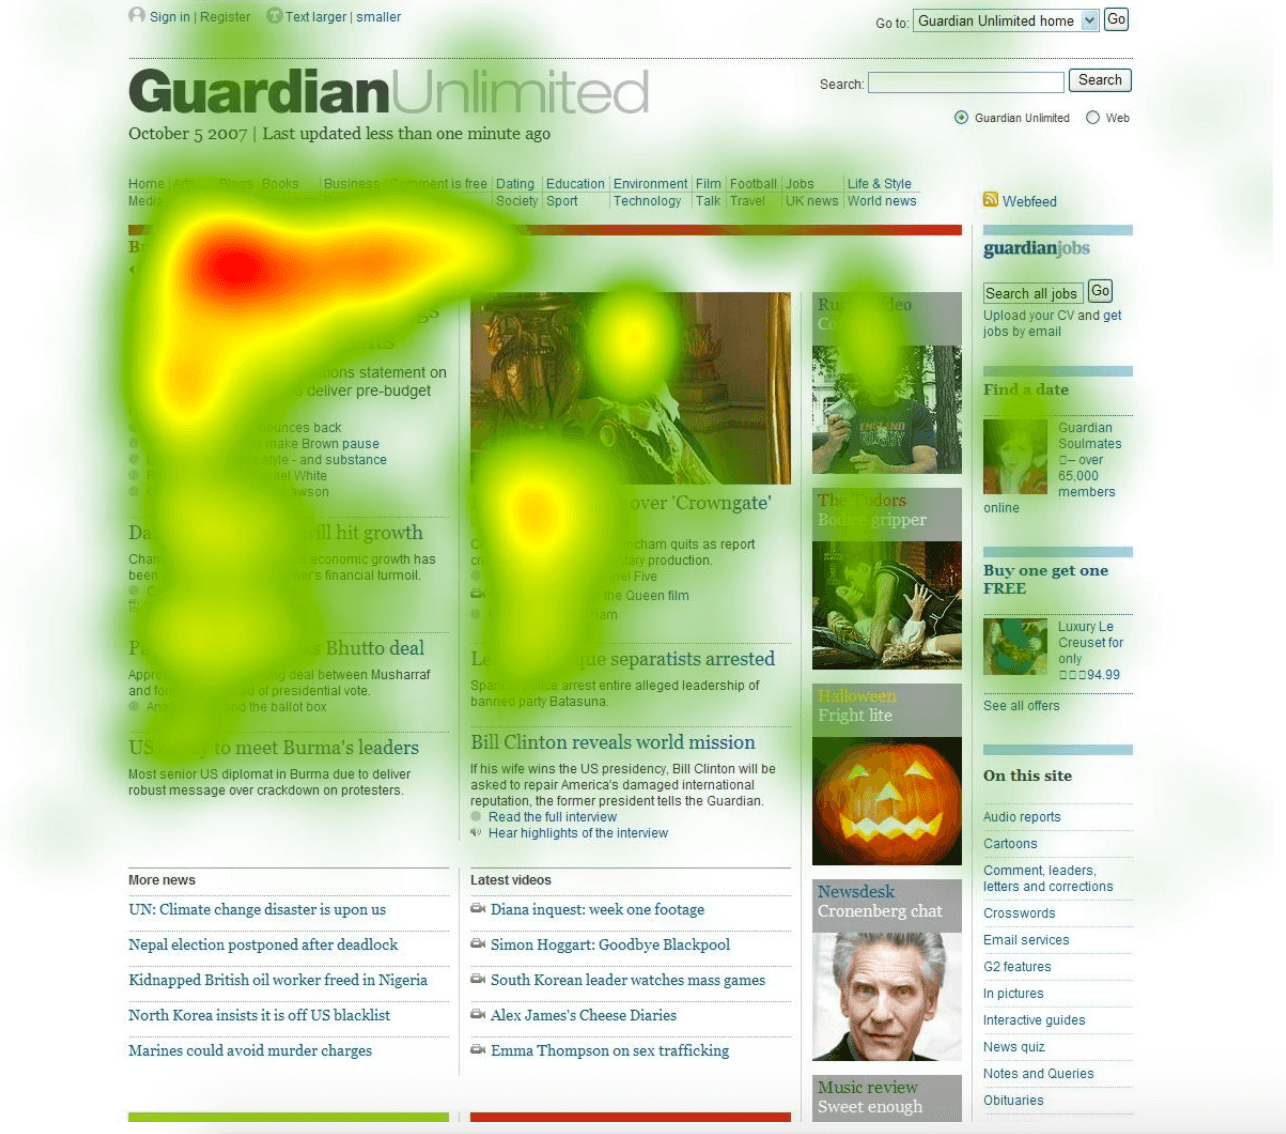
For example, you might learn that certain headlines tend to capture more attention, or that users tend to scroll straight to the footer. Or you might find that a sidebar in your design doesn’t get any attention at all. Eliminating these distractions from your website can increase your conversions and decrease bounce rates. Armed with heat map metrics, you can optimize in a way that matters and makes a difference.
Social Media User Data
While the main focus for many businesses and brands will be on their site data and how to increase user engagement, it’s also important to look at the many different ways users are engaging with your brand outside of your site.
A perfect example of this can be seen through social media. With platforms like Facebook, Instagram and Pinterest leading the way, it’s important to know where your followers are, how many you have, and how many are actually real or not.
Through the use of social media driven analytics, individuals and brands of all sizes can run a report on their social media followers and then be provided with a free and easy to follow report. It’s not just about knowing how many of your followers are real or bots, but how much engagement each of your posts and updates are getting.
These metrics are extremely important to measure out where your marketing efforts and ad spend are getting spent most efficiently.
How to Get the Most Out of Big Data for Your Business
As. you can see from each of the examples above, there are plenty of ways to analyze site and customer data in a wide range of niche markets, while also using different solutions.
The most important factors will differ based on the needs of the company and how they generate new visitors, leads and data. After reading through each of the mentioned metrics, methods and solutions above, you should have a much better idea on how to use big data to grow your business.