You need to have a good grasp of your site’s metrics and traffic information if you want to have any remote chance at making money online. It is only when you are armed with this data that you can suitably and intelligently adapt your content and marketing strategies, giving yourself the opportunity for monumental growth and huge profits.
There are countless different tools available on the Internet for this purpose, but the de facto standard that just about everyone uses is Google Analytics. It’s reliable, it’s robust and it’s free. It’s also really easy to set up Google Analytics and to manage all of your websites under a single Google account. You can check what pages are getting the most traffic, what sites are referring you the most visitors, and where most of your site’s visitors are coming from.
That’s all incredibly useful and you can really drill down to learn more about visitor behavior on your site. One area that far too many webmasters ignore is something called “In-Page Analytics.” In short, it offers very similar data to what you might find with some of the site heat-map tools you’ll find online, but in a somewhat simplified manner. You can access this under the “Behavior” section of Google Analytics.
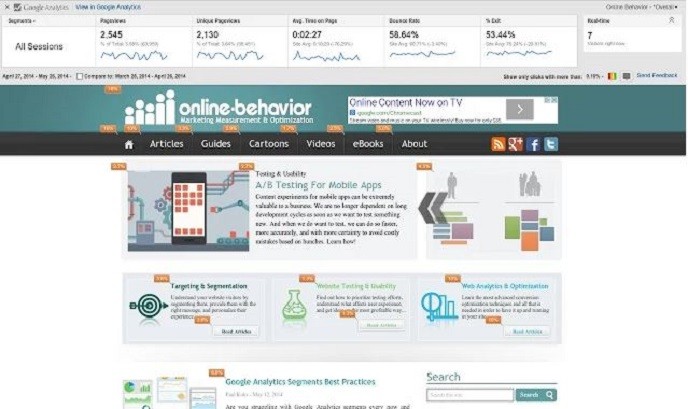

After the page loads up (it analyzes the homepage for your domain by default), you’ll be able to see what links are getting the best click-thru rate on your site. I had some trouble getting it to load properly within Google Analytics itself, but a window pops up giving me the option to view it in a separate browser window.
There are a few important things to note here. You’ll see little bubbles next to the links on your page. These indicate the click-thru rate (as a percentage) for people who visit that page. This is not based on the individual links, however, as it shows the click-thru rate for each destination URL.
What this means is that, for example, if you have more than one link to your advertising page, In-Page Analytics will amalgamate the click-thru rate for all of them combined rather than looking at each link individually. This can make it more difficult for you to determine which link placement is more successful.
Two of the additional options with In-Page Analytics is color-coding, which bases the color on the click-thru percentage (more popular links are red and links with fewer clicks are blue), and browser size, which lets you how much of your site is visible to what percentage of site visitors. You want to make sure that well over 90% of your visitors can actually view the entirety of your content. Otherwise, you may need to rethink your site design.
As mentioned, the In-Page Analytics tool in Google Analytics will default to the homepage for your website, but it can be used for any page on your website too. When you navigate around on your site while in the In-Page Analytics tool, the click-thru data will populate on the resulting pages accordingly. You can also access In-Page Analytics through the “All Pages” sub-section of “Site Content” or use the Chrome extension for added convenience and accessibility.
That’s a really basic overview of how In-Page Analytics works and how you can access the data in Google Analytics. How you choose to proceed with the resulting data is entirely up to you. Perhaps you can move some of the site elements around to encourage a higher click-thru rate on your most desired links, pushing the less desired links to another part of the page. Or you might need multiple calls to the same action. As with all things SEO, site design, and monetization, experimentation (while armed with the right data) is key.